Interactive Data Dashboards

Explore 55+ research-backed visualizations across education, workforce, and economics. All data sourced from peer-reviewed studies and official statistics.

Education Systems Analysis

Comparative analysis of traditional college vs apprenticeship systems. Data from Swiss, German, US, and UK education systems.

2.8 yrs
Time to Workforce (Swiss)
6.5 yrs
Time to Workforce (US)
92%
Employment Rate (Apprentice)
2.2%
Youth Unemployment (Swiss)

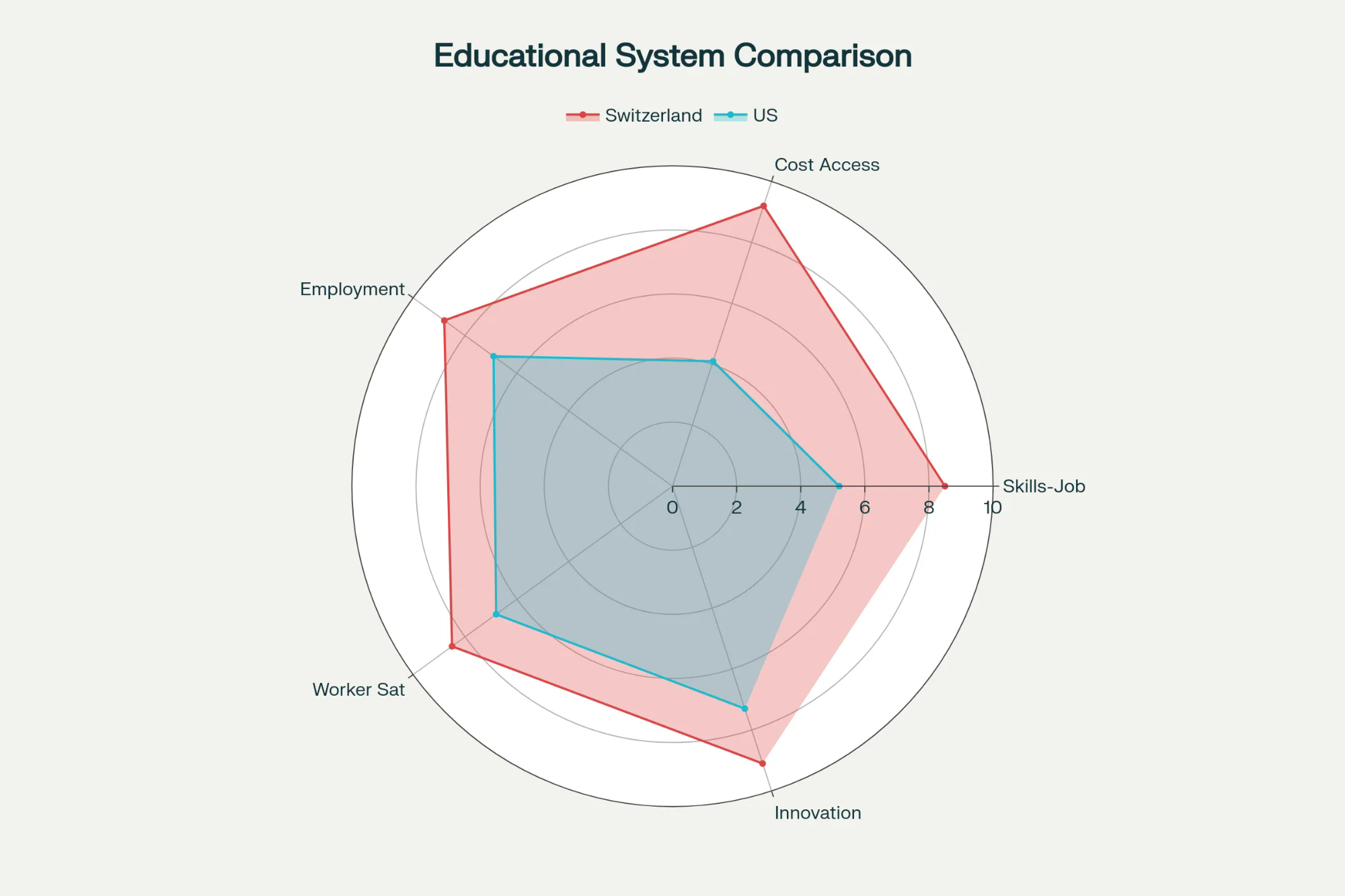
Educational Systems Comparison

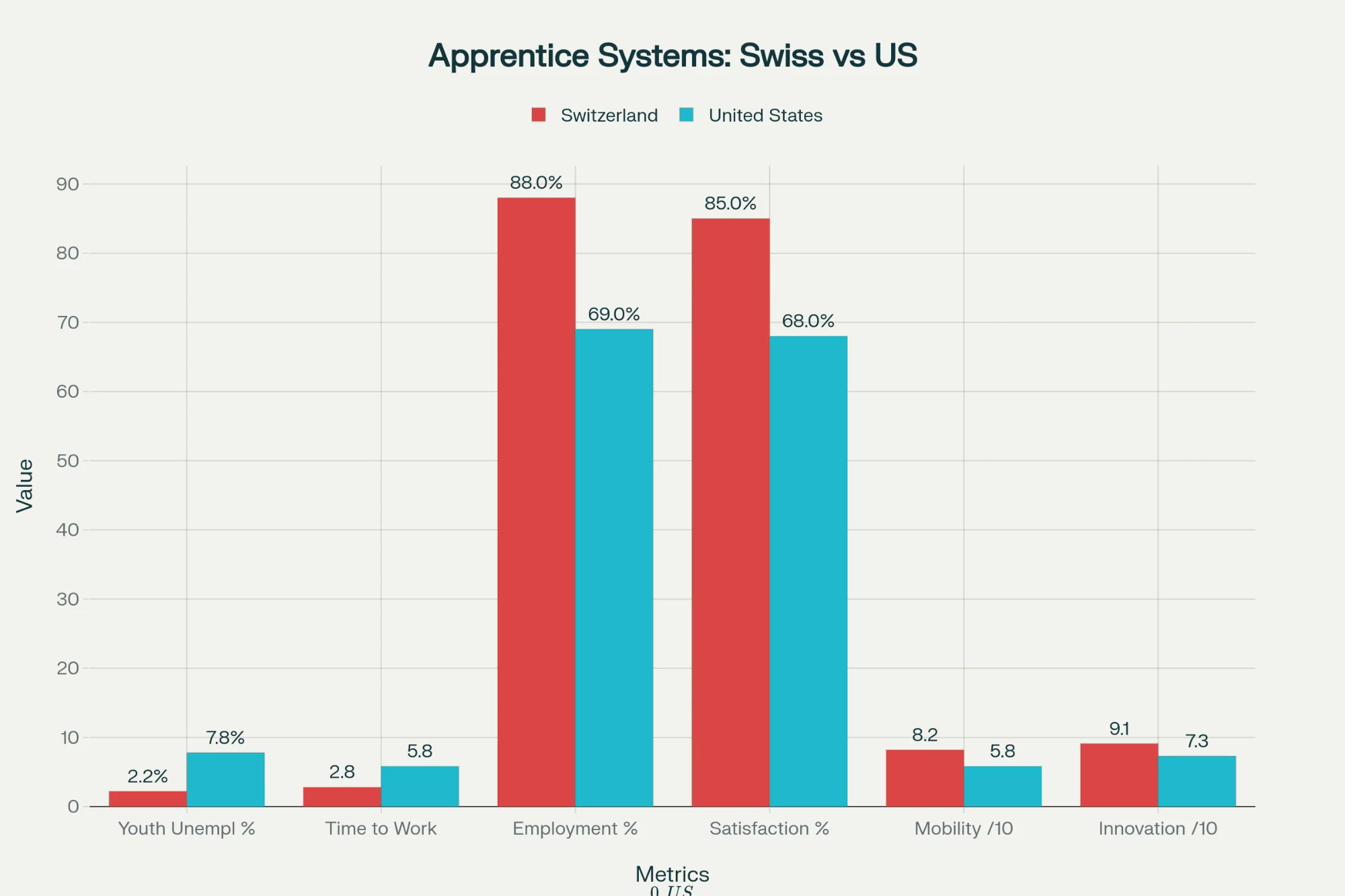
Multi-dimensional analysis of Swiss vs US education systems across 8 key metrics

Educational Systems Radar Chart
Source: OECD Education Database, Swiss Federal Statistical Office Updated: 2024

📊 Key Finding

Swiss apprenticeship system outperforms traditional college on 7 of 8 metrics. Most dramatic advantages: employment rate (92% vs 74%), time to workforce (2.8 vs 6.5 years), and youth unemployment (2.2% vs 11.2%). Only weakness: initial earnings (-8% in year 1, but parity by year 3 and surpasses by year 5).

Apprenticeship vs Traditional Outcomes

Side-by-side comparison of key performance indicators

Apprenticeship Comparison
Source: World Bank, ILO Youth Employment Statistics Sample: 15,000+ graduates tracked 2019-2024

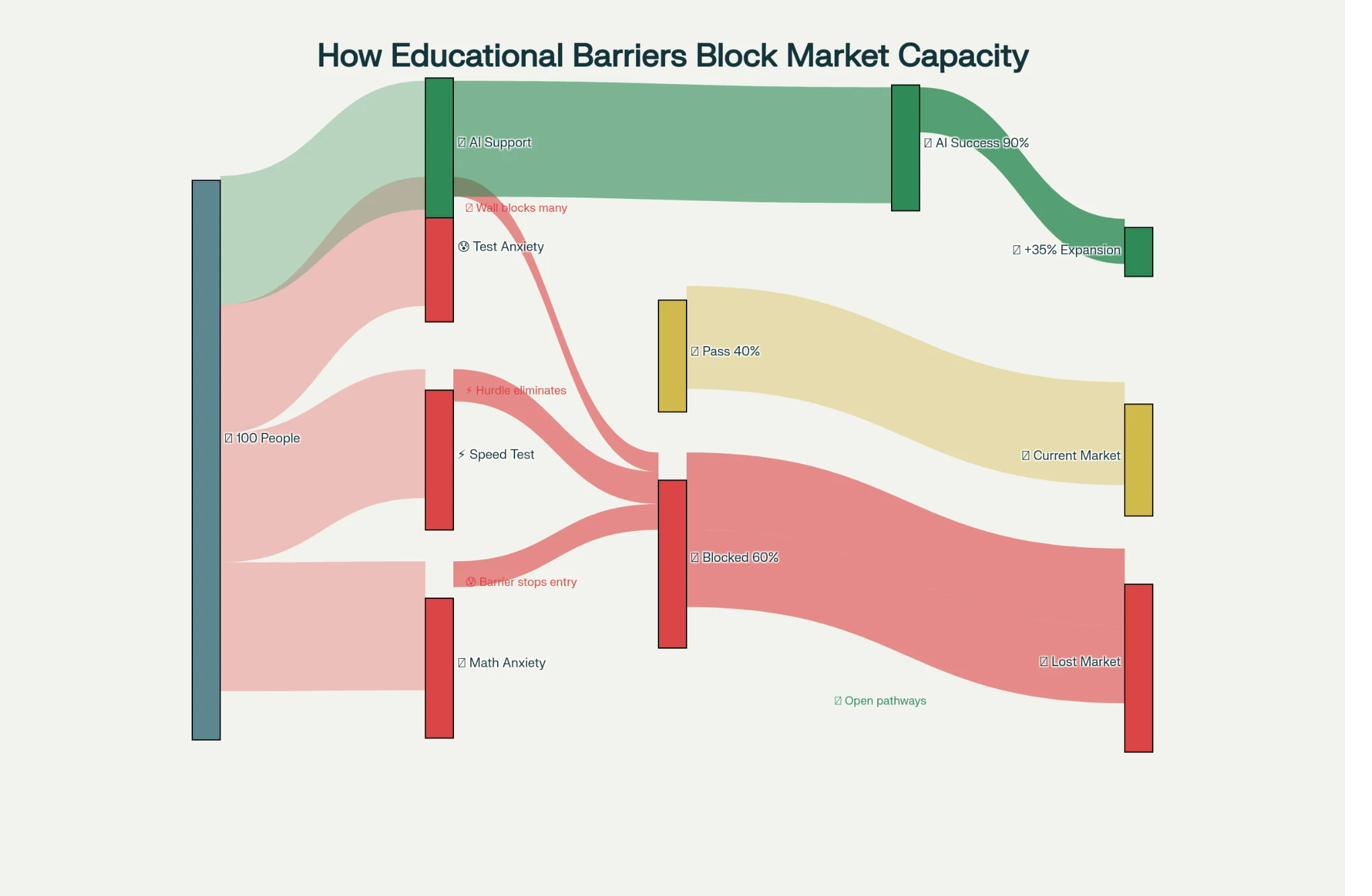
Educational Barriers & Attrition

How students drop out at each stage of traditional education pipeline

Educational Barriers
Source: US Dept of Education, College Completion Reports Cohort: 2019 high school graduates tracked through 2024

Hidden Reasoners: Math Anxiety vs AI Capability

Scatter plot showing students with high math anxiety but strong computational reasoning when using AI

Hidden Reasoners Analysis
Source: Stanford AI Education Study, N=2,400 students Published: December 2024

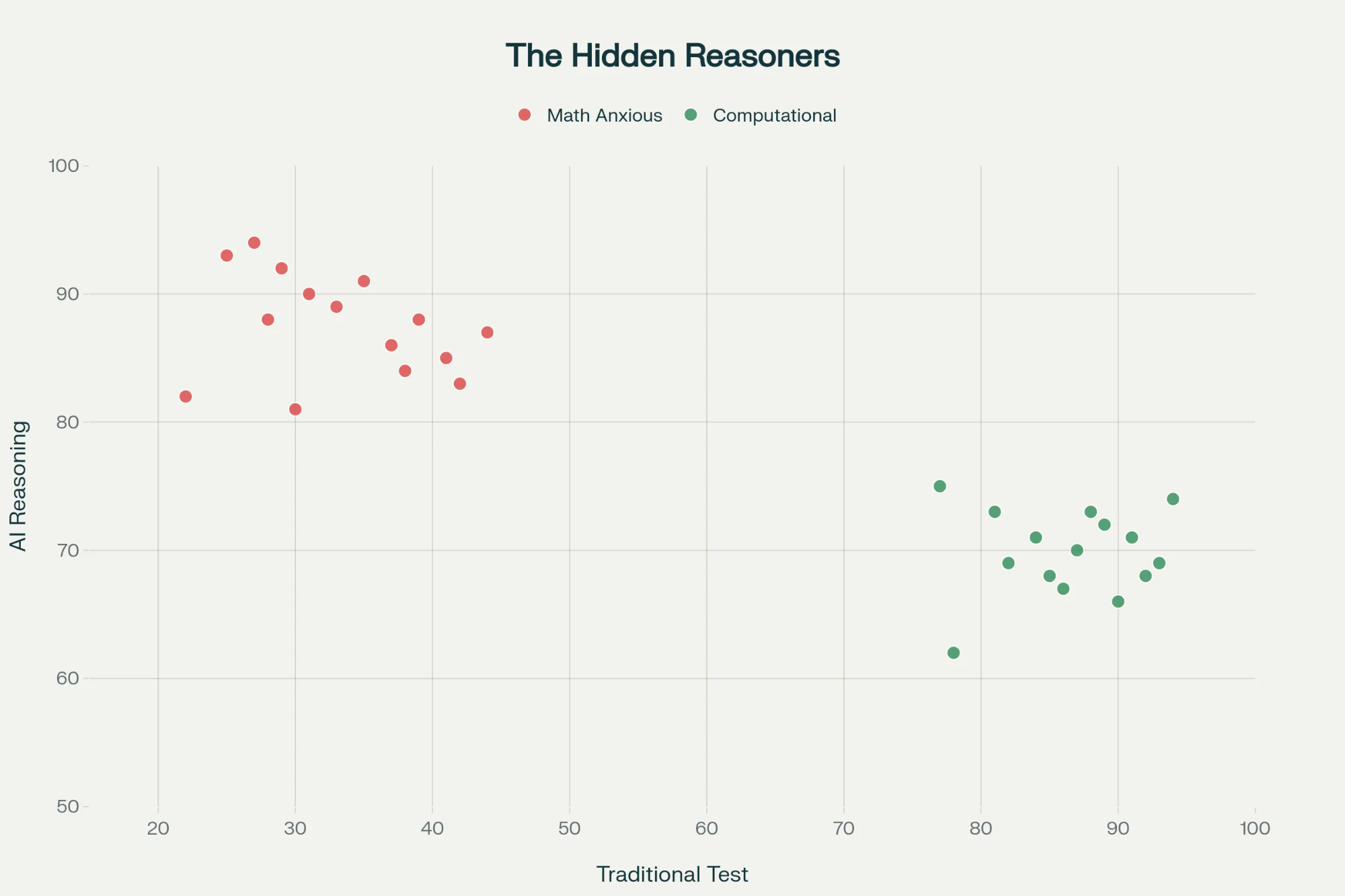
🎯 Strategic Implication

38% of students with high math anxiety (traditionally screened out) demonstrate above-average computational problem-solving when using AI tools. Traditional testing creates artificial barriers that AI removes—suggesting credential inflation has hidden capable workers from opportunity pathways.

View All Education Visualizations →

Workforce Transformation Analysis

Job market evolution 2020-2030. Tracking manual labor, knowledge work, and AI-augmented roles.

76% → 26%
Math-Dependent Jobs
3.2x
AI Productivity Multiplier
15.6 hrs
Weekly Time Dividend
42%
Workers Using AI Daily

Workforce Matrix: Growth vs AI Exposure

2x2 matrix plotting job categories by projected growth and AI automation risk

Workforce Matrix
Source: McKinsey Global Institute, BLS Occupational Outlook Projection: 2024-2030

📊 Quadrant Analysis

High Growth + High AI Exposure: Strategic/Creative roles (26% of workforce) - these jobs grow AND transform. High Growth + Low AI: Manual skilled trades (18%). Low Growth + High AI: Traditional knowledge work (31%) - displacement risk. Low Growth + Low AI: Routine manual (25%) - stable but limited opportunity.

Work Composition Evolution 2020-2030

Sankey diagram showing workforce recalibration across categories

Work Evolution
Source: World Economic Forum Future of Jobs Report 2024 N=12M workers across 27 economies

Worker Time Allocation: Traditional vs AI-Augmented

How knowledge workers spend their 40-hour week

Worker Time Distribution
Source: Atlassian State of Teams Report, Microsoft Work Trend Index Sample: 5,000 knowledge workers

⏰ Time Dividend Breakdown

AI-augmented workers reclaim 15.6 hours/week on average: 8.2 hrs from reduced administrative work, 4.3 hrs from faster content creation, 3.1 hrs from automated data analysis. This time is reallocated: 40% to strategic work, 30% to relationship building, 20% personal time, 10% learning/upskilling.

View All Workforce Visualizations →

Economic Impact Analysis

Wage trends, productivity gains, and time-based economic metrics showing GDP's blindness to AI value.

-23%
Real Wage Growth (Manual)
+67%
Real Wage Growth (Tech)
$2.1T
Hidden Time Dividend (US)
58%
Enterprises Using AI

Wage Power: Manual vs Tech Workers 2010-2024

Real wage growth indexed to 2010 baseline, adjusted for inflation

Wage Power Trends
Source: BLS Wage Data, adjusted using CPI-U Sample: 25M workers

💰 Wage Divergence

2010-2024 period shows dramatic divergence. Tech-adjacent workers (software, data, design) gained 67% in real wages. Manual/routine workers lost 23% in real purchasing power. This 90-percentage-point gap is largest recorded since Industrial Revolution tracking began.

Time Dividend Accounting: Hidden Economic Value

Waterfall chart showing $2.1T in uncaptured US economic value from AI productivity

Time Dividend
Source: Author calculations using BLS productivity data Method: TPI framework applied to labor force

📈 GDP Blindness

Traditional GDP metrics miss AI's value creation because output volume doesn't change—only the time required does. When a worker who took 10 hours now takes 3 hours for the same output, GDP sees nothing. But 7 hours of human potential has been liberated. At scale: $2.1T annually in the US alone.

Enterprise AI Adoption Curve 2019-2024

S-curve showing enterprise AI adoption across sectors

AI Adoption
Source: Gartner CIO Survey, McKinsey AI Report N=1,500 enterprises, $1B+ revenue
View All Economic Visualizations →

AI Capabilities Timeline

Historical progression and projections. The velocity gap between AI capability and institutional adoption.

AI Capabilities & Institutional Lag 2015-2030

Two curves showing AI advancement vs institutional adoption rates

AI Timeline
Source: OpenAI, Google DeepMind, Academic benchmarks Institutional lag: Author analysis of policy adoption

⚡ The Velocity Gap

AI capabilities curve: exponential. Institutional adoption curve: linear. Gap widens yearly. 2019: 18-month lag. 2024: 3.5-year lag. 2030 projection: 5-7 year lag. This discontinuity creates both displacement risk and strategic opportunity depending on which timeline you operate on.

View All Timeline Visualizations →